The Profile
The National Equity Atlas was invited into the Lancaster County community in the summer of 2021 to support a collaborative process of asking questions, finding data, and determining ways to create an impact to improve racial equity.
As a research partnership between PolicyLink and the USC Equity Research Institute, the National Equity Atlas has completed dozens of equity profiles of cities, counties, and regions over the past 10 years and brings deep awareness and commitment to the data and the policy recommendations that can create change. This is the first county wide racial equity profile in Pennsylvania, and our hope is that it will serve as a benchmark to show us where we are as a county and where we can continue to improve.
Indicators:
Demographics
Who lives in the county and how is this changing?
The county is experiencing a demographic shift. Demographic change has occurred more slowly in Lancaster County compared to the nation. However, the proportion of the population who are people of color and immigrants continues to steadily increase in the county.
The increase in the Black and Latinx populations will continue to drive growth in the county. Between 2020 and 2050, the Latinx population to increase from 11 percent to 20 percent of the total population, and the Black population is anticipated to increase from 4 percent to 6 percent.

How do the county’s residents differ by age?
Young people are leading the demographic shift in the county. Currently, about 26 percent of the youth (under age 18) in Lancaster County are people of color, compared with only seven percent of the county’s seniors (65 and older) who are people of color. This 19-percentage point difference between the share of people of color among young and old can be measured as the racial generation gap. Since 1980, the racial generation gap has grown by 13 percentage points.

Economic Vitality

How does race affect hourly wages?
Wages also tend to increase with higher educational attainment, but people of color have lower median hourly wages at every education level compared with their white counterparts.
White workers out-earn workers of color with similar educational levels, earning $3 to $5 more per hour on average.

How does where you live impact poverty level?
Poverty rates are highest around the city center of the county as well as pockets of rural Lancaster.
Neighborhoods with high levels of poverty are seen in the southeastern quadrant of the city as well as the further outskirts of the county.

Is child poverty low?
Latinx and Black children have the highest poverty rates. In 2019, the child poverty rates for Latinx and Black children were 34 percent and 33 percent, more than double the county average and three times the rate for white children. By way of comparison, only about nine percent of white children lived in poverty. The rate for all children of color combined was 29 percent.

Youth Preparedness
Do teachers reflect the diversity of their students?
Lancaster County’s student population is more diverse than the population overall, but people of color are significantly underrepresented among teachers. About 35 percent of students are people of color, but only four percent of their teachers are people of color. This underrepresentation is most stark among Latinx teachers: one in five students in Lancaster County are Latinx, compared to just two percent of teachers.
Black and Asian students make up six and three percent of the student population, respectively. But there are very few Black or Asian teachers in the county. Studies have shown that students of color perform better and receive better educational support when taught by teachers of color.

Connectedness
Are residents paying too much for housing?
High rent burden is a county-wide issue. In several communities a large share of renter households spend more than 30 percent of their income on rent, leaving less money to pay for other expenses such as childcare, healthcare, and wealth-building. As higher-end housing development continues to push out residents, affordable housing will continue to be a barrier to equitable growth for all Lancaster residents.
Health Outcomes
Are all residents able to live a full life?
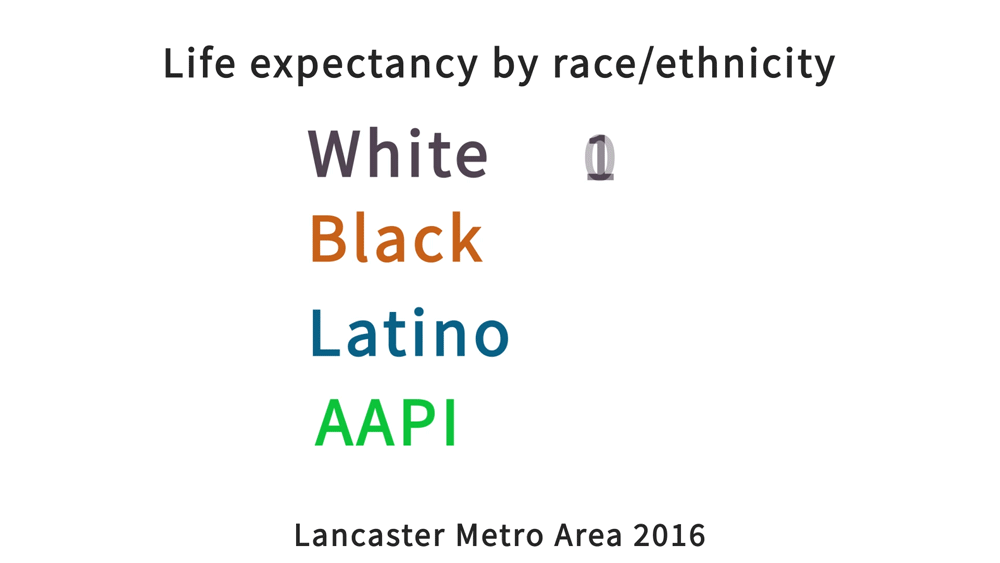
Life expectancy, a key indicator for health and opportunity, is highest among Asian or Pacific Islander and white residents in the county. Black residents have the shortest life expectancy at 75 years, compared to 80 years for white residents.
Structural racism, inequitable access to opportunities, healthy foods, and safe and secure environments all contribute to how long and how well someone may live.

The Justice System
Are all residents being treated fairly by the court of law?
Cash bail for Black defendants tends to be set at much higher amounts than bail for white defendants. The average cash bail from 2016 to 2017 was set at over $66,000 for Black defendants, compared to $55,000 for white defendants. Judges are also more likely to impose cash bail for Black defendants than for white defendants.
Monetary bail punishes low-income defendants and is especially harsh for defendants of color, further perpetuating systems of incarceration and harm rather than justice.

Economic Benefits of Equity
How much higher would GDP be without racial economic inequities?
Lancaster County stands to gain a great deal from addressing racial inequities. The county’s economy could have been nearly two billion dollars stronger in 2019 if its racial gaps in income had been closed: more than a six percent increase.
Using data on income by race, we calculated how much higher total economic output would have been in 2019 if all racial groups who currently earn less than whites had earned similar average incomes as their white counterparts, controlling for age.